
Page 83 - MA - May 2017
P. 83
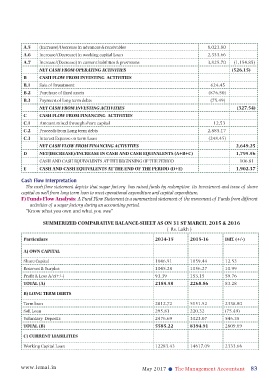
A.5    (Increase)/Decrease in advances & receivables                          8,023.80
          A.6    Increase/(Decrease) in working capital Loan                            2,333.66
          A.7    Increase/(Decrease) in current liabilities & provisions                3,825.70     (1,154.85)
                 NET CASH FROM OPERATING ACTIVITIES                                          (526.15)
          B      CASH FLOW FROM INVESTING  ACTIVITIES
          B.1    Sale of Investment                                                        624.45
          B.2    Purchase of fixed assets                                                (876.50)
          B.3    Payment of long term debts                                                (75.49)
                 NET CASH FROM INVESTING ACTIVITIES                                                  (327.54)
          C      CASH FLOW FROM FINANCING  ACTIVITIES
          C.1    Amount raised through share capital                                          12.53
          C.2    Proceeds from Long term debts                                          2,885.17
          C.3    Interest Expense on term Loan                                           (248.45)
                 NET CASH FLOW FROM FINANCING ACTIVITIES                                         2,649.25
          D      NET(DECREASE)/INCREASE IN CASH AND CASH EQUIVALENTS (A+B+C)                     1,795.56
                 CASH AND CASH EQUIVALENTS AT THE BEGINNING OF THE PERIOD                            106.81
          E      CASH AND CASH EQUIVALENTS AT THE END OF THE PERIOD (D+E)                        1,902.37

          Cash Flow Interpretation
           The cash flow statement depicts that sugar factory  has raised funds by redemption  its Investment and issue of share
          capital as well from long term loan to meet operational expenditure and capital expenditure.
          F) Funds Flow Analysis: A Fund Flow Statement is a summarized statement of the movement of Funds from different
             activities of a sugar factory during an accounting period.
           “Know what you own and what you owe”

                  SUMMERIZED COMPARATIVE BALANCE-SHEET AS ON 31 ST MARCH, 2015 & 2016
                                                                   (  Rs. Lakh )
          Particulars                                         2014-15       2015-16       Diff. (+/-)

          A) OWN CAPITAL

          Share Capital                                       1046.91       1059.44       12.53
          Reserves & Surplus                                  1045.28       1056.27       10.99
          Profit & Loss A/c(+/-)                              93.39         153.15        59.76
          TOTAL (A)                                           2185.58       2268.86       83.28

          B) LONG TERM DEBTS
          Term loan                                           2812.72       5151.52       2338.80
          Soft Loan                                           295.81        220.32        (75.49)
          Voluntary  Deposits                                 2476.69       3023.07       546.38
          TOTAL (B)                                           5585.22       8394.91       2809.69
          C) CURRENT LIABILITIES

          Working Capital Loan                                12283.43      14617.09      2333.66


         www.icmai.in                                    May 2017 l  The Management Accountant      83