
Page 78 - MA - May 2017
P. 78
CASE STUDY
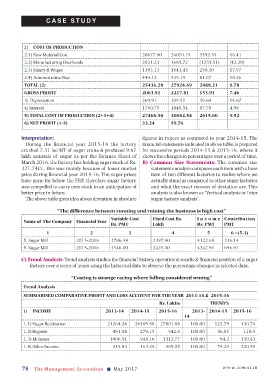
2) COST OF PRODUCTION
2.1) Raw Material Cost 20677.80 24070.15 3392.35 16.41
2.2) Manufacturing Overheads 2921.23 1685.72 (1235.51) (42.29)
2.3) Salary & Wages 1393.13 1643.43 250.30 17.97
2.4) Administrative Exp. 444.12 525.19 81.07 18.26
TOTAL (2) 25436.28 27924.49 2488.21 9.78
GROSS PROFIT 2063.91 2217.81 153.91 7.46
3) Depreciation 269.91 309.51 39.60 14.67
4) Interest 1760.75 1848.54 87.79 4.99
5) TOTAL COST OF PRODUCTION (2+3+4) 27466.94 30082.54 2615.60 9.52
6) NET PROFIT (1-5) 33.24 59.76
Interpretation: figures in rupees as compared to year 2014-15. The
During the financial year 2015-16 the factory financial statements indicated in above table, is prepared
crushed 7.31 lac MT of sugar crane & produced 9.67 for successive periods 2014-15 & 2015-16, where it
lakh quintals of sugar as per the Balance Sheet of shows the changes in percentages over a period of time.
March 2016, the factory has holding sugar stock of Rs. B) Common Size Statements: The common size
321.74Cr., this was mainly because of lower market statements analysis compares each item with a base
price during financial year 2015-16. The sugar prices item of two different factories to realize where we
have gone far below the FRP, therefore sugar factory actually stand as compared to other sugar factories
was compelled to carry over stock in an anticipation of and what the exact reasons of deviation are. This
better price in future. analysis is also known as ‘Vertical analysis or Inter
The above table gives idea about deviation in absolute sugar factory analysis’.
“The difference between running and ruining the business is high cost”
Variable Cost Fixed Cost Rs. Income Contribution
Name of The Company Financial Year
Rs. PMT Lakh Rs. PMT PMT
1 2 3 4 5 6 =(5-3)
X Sugar Mill 2015-2016 3786.54 2397.90 4122.69 336.14
Y Sugar Mill 2015-2016 3546.00 2425.10 4242.91 696.91
C) Trend Analysis: Trend analysis studies the financial history, operational results & financial position of a sugar
factory over a series of years using the historical data to observe the percentage changes in selected data.
“Costing is strange racing where falling considered wining”
Trend Analysis
SUMMARISED COMPARATIVE PROFIT AND LOSS ACCOUNT FOR THE YEAR 2013-14 & 2015-16
Rs. Lakhs TREND%
1) INCOME 2013-14 2014-15 2015-16 2013- 2014-15 2015-16
14
1.1) Sugar Realization 21264.26 26109.58 27801.88 100.00 122.79 130.74
1.2) Bagasse 491.04 279.15 542.6 100.00 56.85 110.5
1.3) Molasses 1006.51 948.16 1312.77 100.00 94.2 130.43
1.4) Other Income 219.93 163.29 485.05 100.00 74.24 220.55
78 The Management Accountant l May 2017 www.icmai.in