
Page 79 - MA - May 2017
P. 79
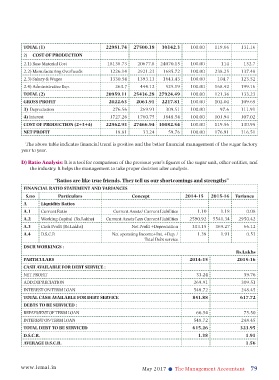
TOTAL (1)                        22981.74   27500.18   30142.3    100.00    119.66    131.16
          2)  COST OF PRODUCTION
          2.1) Raw Material Cost            18138.73   20677.8  24070.15    100.00       114      132.7
          2.2) Manufacturing Overheads       1226.14   2921.23    1685.72   100.00    238.25    137.48
          2.3) Salary & Wages                1330.54   1393.13    1643.43   100.00     104.7    123.52
          2.4) Administrative Exp.             263.7     444.12    525.19   100.00    168.42    199.16
          TOTAL (2)                        20959.11   25436.28 27924.49     100.00    121.36    133.23
          GROSS PROFIT                      2022.63    2063.91   2217.81    100.00    102.04    109.65
          3)  Depreciation                    276.56     269.91    309.51   100.00      97.6    111.91
          4) Interest                        1727.26   1760.75    1848.54   100.00    101.94    107.02
          COST OF PRODUCTION (2+3+4)       22962.93   27466.94 30082.54     100.00    119.56    130.95
          NET PROFIT                           18.81      33.24     59.76   100.00    176.91    316.51

           The above table indicates financial trend is positive and the better financial management of the sugar factory
          year to year.

          D) Ratio Analysis: It is a tool for comparison of the previous year’s figures of the sugar unit, other entities, and
             the industry. It helps the management to take proper decision after analysis.

                       “Ratios are like true friends. They tell us our shortcomings and strengths”
          FINANCIAL RATIO STATEMENT AND VARIANCES
           S.no         Particulars                  Concept              2014-15    2015-16  Variance
          A      Liquidity Ratios
          A.1    Current Ratio                Current Assets/ Current Liabilities  1.10  1.18      0.08
          A.2    Working Capital  (Rs.Lakhs)  Current Assets Less Current Liabilities  2590.92  5541.34  2950.42
          A.3    Cash Profit (Rs.Lakhs)              Net Profit +Depreciation  303.15  369.27     66.12
          A.4    D.S.C.R                     Net operating Income+Int. +Dep. /  1.38    1.91       0.53
                                                          Total Debt service
          DSCR WORKINGS :
                                                                                                                                                                                                     Rs.Lakhs
          PARTICULARS                                                       2014-15            2015-16
          CASH AVAILABLE FOR DEBT SERVICE :
          NET PROFIT                                                           33.24              59.76
          ADD:DEPRECIATION                                                    269.91             309.51
          INTEREST ON TERM LOAN                                               548.72             248.45
          TOTAL CASH AVAILABLE FOR DEBT SERVICE                              851.88             617.72
          DEBTS TO BE SERVICED :
          REP AYMENT OF TERM LOAN                                              66.54              75.50
          INTEREST ON TERM LOAN                                               548.72             248.45
          TOTAL DEBT TO BE SERVICED                                          615.26             323.95
          D.S.C.R.                                                              1.38              1.91
          AVERAGE D.S.C.R.                                                                        1.56


         www.icmai.in                                    May 2017 l  The Management Accountant      79