
Page 84 - MA - May 2017
P. 84
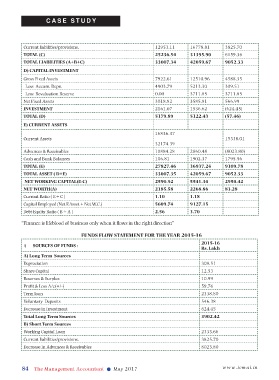
CASE STUDY


          Current liabilities/provisions.                     12953.11      16778.81      3825.70
          TOTAL (C)                                           25236.54      31395.90      6159.36
          TOTAL LIABILITIES (A+B+C)                           33007.34      42059.67      9052.33
          D) CAPITAL INVESTMENT
          Gross Fixed Assets                                  7922.61       12510.96      4588.35
            Less: Accum. Depn.                                4903.79       5213.30       309.51
            Less: Revaluation Reserve                         0.00          3711.85       3711.85
          Net Fixed Assets                                    3018.82       3585.81       566.99
          INVESTMENT                                          2161.07       1536.62       (624.45)
          TOTAL (D)                                           5179.89       5122.43       (57.46)
          E) CURRENT ASSETS
                                                              16836.37
          Current Assets                                                                  15338.01
                                                              32174.39
          Advances & Receivables                              10884.28      2860.48       (8023.80)
          Cash and Bank Balances                              106.81        1902.37       1795.56
          TOTAL (E)                                           27827.46      36937.24      9109.78
          TOTAL ASSET ( D+E)                                  33007.35      42059.67      9052.33
           NET WORKING CAPITAL(E-C)                           2590.92       5541.34       2950.42
          NET WORTH(A)                                        2185.58       2268.86       83.28
          Current Ratio ( E ÷ C )                             1.10          1.18
          Capital Employed (Net F.Asset + Net W.C.)           5609.74       9127.15
          Debt Equity Ratio ( B ÷ A )                         2.56          3.70
          “Finance is lifeblood of business only when it flows in the right direction”

                                 FUNDS FLOW STATEMENT FOR THE YEAR 2015-16
                                                                                 2015-16
          I)   SOURCES OF FUNDS :
                                                                                 Rs. Lakh
          A) Long Term  Sources
          Depreciation                                                           309.51
          Share Capital                                                          12.53
          Reserves & Surplus                                                     10.99
          Profit & Loss A/c(+/-)                                                 59.76
          Term loan                                                              2338.80
          Voluntary  Deposits                                                    546.38
          Decrease in Investment                                                 624.45
          Total Long Term Sources                                                3902.42
          B) Short Term Sources
          Working Capital Loan                                                   2333.66
          Current liabilities/provisions.                                        3825.70
          Decrease In Advances & Receivables                                     8023.80


          84   The Management Accountant  l   May 2017                                   www.icmai.in