
Page 80 - MA - May 2017
P. 80
CASE STUDY
Interpretation
Above statement show that, significant improvement in major liquidity ratios. Current ratio has increased from
1.10 to 1.18 in the year 2015-16. An ideal current ratio is 2:1.
“Absolute figures unless converted into relative ones are meaningless.”
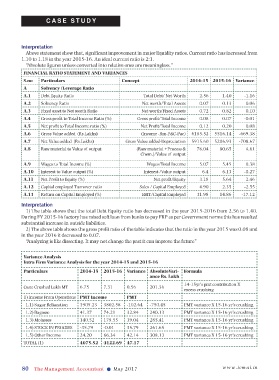
FINANCIAL RATIO STATEMENT AND VARIANCES
S.no Particulars Concept 2014-15 2015-16 Variance
A Solvency /Leverage Ratio
A.1 Debt Equity Ratio Total Debt/ Net Worth 2.56 1.40 -1.16
A.2 Solvency Ratio Net worth/Total Assets 0.07 0.13 0.06
A.3 Fixed asset to Net worth Ratio Net worth/Fixed Assets 0.72 0.82 0.10
A.4 Gross profit to Total Income Ratio (%) Gross profit/Total Income 0.08 0.07 -0.01
A.5 Net profit to Total Income ratio (%) Net Profit/Total Income 0.12 0.20 0.08
A.6 Gross Value added (Rs.Lakhs) (Income -Rm-P&C-Pac) 6185.52 5516.14 -669.38
A.7 Net Value added (Rs.Lakhs) Gross Value added-Depreciation 5915.60 5206.93 -708.67
A.8 Raw material to Value of output (Raw material +Process & 76.04 80.65 4.61
Chem.)/Value of output
A.9 Wages to Total Income (%) Wages/Total Income 5.07 5.45 0.38
A.10 Interest to Value output (%) Interest /Value output 6.4 6.13 -0.27
A.11 Net Profit to Equity (%) Net profit/Equity 3.18 5.64 2.46
A.12 Capital employed Turnover ratio Sales / Capital Employed 4.90 2.35 -2.55
A.13 Return on Capital Employed (%) EBIT/Capital Employed 31.98 14.86 -17.12
Interpretation
1) The table shows that the total Debt Equity ratio has decreased in the year 2015-2016 from 2.56 to 1.40.
During FY 2015-16 factory has raised soft loan from banks to pay FRP as per Government norms this has resulted
substantial increase in outside liabilities.
2) The above table shows the gross profit ratio of the table indicates that the ratio in the year 2015 was 0.08 and
in the year 2016 it decreased to 0.07.
“Analyzing is like dissecting. It may not change the past it can improve the future”
Variance Analysis
Intra Firm Variance Analysis for the year 2014-15 and 2015-16
Particulars 2014-15 2015-16 Variance AbsoluteVari- Formula
ance Rs. Lakh
14-15yr’s pmt contribution X
Cane Crushed Lakh MT 6.75 7.31 0.56 201.36
excess crushing
1) Income From Operations PMT Income PMT
1.1) Sugar Reliazation 3905.23 3802.58 -102.64 -750.45 PMT variance X 15-16 yr’s crushing
1.2) Bagasse 41.37 74.21 32.84 240.13 PMT variance X 15-16 yr’s crushing
1.3) Molasses 140.52 179.55 39.04 285.41 PMT variance X 15-16 yr’s crushing
1.4) STOCK IN PROCESS -35.79 -0.01 35.79 261.65 PMT variance X 15-16 yr’s crushing
1.5) Other Income 24.20 66.34 42.14 308.13 PMT variance X 15-16 yr’s crushing
TOTAL (1) 4075.52 4122.69 47.17
80 The Management Accountant l May 2017 www.icmai.in