
Page 98 - MA - May 2017
P. 98
CAPITAL MARKET
companies in the sample taken as per purposive sampling technique. The estimation of the adopted accounting
measure is based on the annual balance sheets and income statement of this Sensex companies. The information
is used in this study are from BSE database.
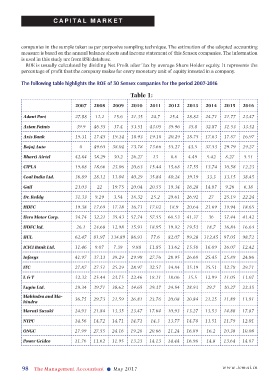
ROE is usually calculated by dividing Net Profit after Tax by average Share Holder equity. It represents the
percentage of profit that the company makes for every monetary unit of equity invested in a company.
The following table highlights the ROE of 30 Sensex companies for the period 2007-2016
Table 1:
2007 2008 2009 2010 2011 2012 2013 2014 2015 2016
Adani Port 27.88 11.2 15.6 21.35 24.7 25.4 28.82 24.71 21.77 23.47
Asian Paints 39.9 46.55 37.4 53.51 43.05 39.96 35.8 32.87 31.53 33.52
Axis Bank 19.31 17.45 19.14 18.93 19.18 20.29 18.75 17.63 17.87 16.97
Bajaj Auto 0 49.65 38.04 73.78 73.66 55.27 43.5 37.53 29.79 29.27
Bharti Airtel 42.84 38.29 30.2 26.27 13 8.6 4.49 5.42 8.27 5.51
CIPLA 19.88 18.66 23.06 20.63 15.44 15.68 17.55 13.74 10.58 12.23
Coal India Ltd. 36.89 28.12 11.04 40.29 35.84 40.24 39.19 33.3 33.15 38.45
Gail 23.03 22 19.75 20.04 20.55 19.34 16.28 14.87 9.26 6.38
Dr. Reddy 31.33 9.29 3.54 18.32 25.2 29.61 26.92 27 25.19 22.24
HDFC 19.38 17.69 17.18 16.71 17.02 18.9 20.64 21.69 19.94 18.65
Hero Motor Corp. 34.74 32.21 35.43 57.74 57.55 60.53 41.37 36 37.44 41.42
HDFC ltd. 26.1 24.68 12.98 15.91 18.95 19.92 19.53 18.7 16.84 16.64
HUL 62.47 81.97 134.89 86.91 77.6 82.07 99.28 112.45 97.05 98.72
ICICI Bank Ltd. 11.46 9.07 7.39 9.88 11.85 13.62 15.58 16.09 16.07 12.42
Infosys 41.97 37.13 39.29 29.98 27.76 28.95 26.68 25.45 25.89 24.86
ITC 27.87 27.51 25.29 28.97 32.57 34.84 35.19 35.51 32.78 29.71
L & T 32.32 25.44 23.75 22.46 18.11 18.06 15.5 12.99 11.05 11.07
Lupin Ltd. 29.34 39.71 38.62 34.65 29.37 24.54 28.93 29.7 30.27 22.35
Mahindra and Ma-
hindra 36.75 29.73 21.59 26.81 23.76 20.08 20.84 21.25 11.89 11.91
Maruti Suzuki 24.93 21.84 13.35 23.47 17.64 10.93 13.27 13.53 14.88 17.87
NTPC 14.56 14.72 14.71 14.71 14.3 13.77 14.78 13.51 11.79 12.01
ONGC 27.99 27.55 24.16 19.28 20.66 21.24 16.89 16.2 10.38 10.08
Power Gridco 11.76 11.62 11.95 13.23 14.13 14.44 16.98 14.8 13.64 14.87
98 The Management Accountant l May 2017 www.icmai.in