
Page 100 - MA - May 2017
P. 100
CAPITAL MARKET
Actual and expected average ROE: A diagnostic comparison
To make the study more meaningful, a comparison between actual average ROE and expected average ROE has
been made. For forecasting the expected average ROE, Exponential Smoothing Model is used.
GST
Exponential Smoothing Model: A conceptual framework and application
It is a technique or method of forecasting data without following any trend or seasonality. We consider the recent data to
forecast rather than old data like in any other forecasting tools.
Traditionally, we denote the observed value as and smoothed average as .
Then,
undefined
and, generalized
Where, , the smoothing constant, takes the value from the range [0;1)
In this exponential smoothing model the is taken as 0.5. The forecasted values of average ROE for the 10years have been
computed and presented in the following table:
Table-2: Forecasted Value of Average ROE by Exponential Smoothing Model
Year 2007 2008 2009 2010 2011 2012 2013 2014 2015 2016
Actual Average Of
ROE 28.96 28.4 24.97 27.7 28.7 27 24.72 24.97 21.61 21.09
Forecasting Value Of 28.96 28.68 26.82 27.25 27.96 27.46 26.09 25.53 23.57 22.33
ROE
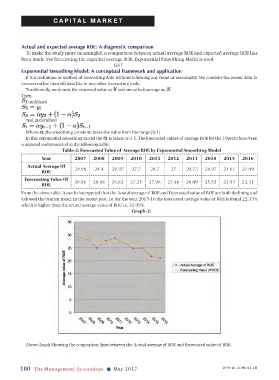
From the above table, it can be interpreted that the Actual average of ROE and Forecasted value of ROE are both declining and
followed the bearish trend. In the recent past, i.e. for the year 2015-16 the forecasted average value of ROE is found 22.33%
which is higher than the actual average value of ROE i.e. 21.09%.
Graph-2:
Above Graph Showing the comparison lines between the Actual average of ROE and Forecasted value of ROE.
100 The Management Accountant l May 2017 www.icmai.in