
Page 99 - MA - May 2017
P. 99
RIL 20.49 24.24 14.66 18.16 12.85 11.61 11.2 11.03 10.82 11.25
SBI 16.6 17.76 16.72 15.45 13.42 16.69 15.85 10.64 11.35 7.48
Sun Pharma 33.51 38.06 29.9 17.84 20.35 23.36 24.76 28.86 21.07 18.13
TATA Motors 30.29 23.88 -28.4 26.19 66.08 53.01 29.86 25.77 23.07 21.82
TATA Steel 33.71 31.25 24.52 -11.04 27.54 6.71 -19.11 8.72 -15.63 -17.88
TCS 55.59 44.1 41.16 41.13 42.33 39.53 40.61 43.32 36.92 40.41
Wipro 35.99 30.6 32.09 29.16 25.78 21.66 21.66 25.67 23.5 20.77
TOTAL 868.8 852 749 831 860 809 741.6 749 648.4 632.6
Average of 30 Com- 28.96 28.4 24.97 27.7 28.7 27 24.72 24.97 21.61 21.09
panies
Source BSE database
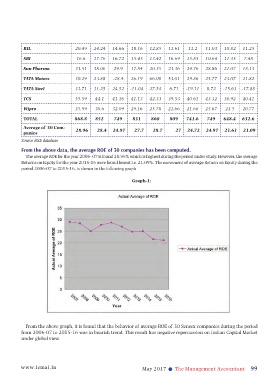
From the above data, the average ROE of 30 companies has been computed.
The average ROE for the year 2006- 07 is found 28.96% which is highest during the period under study. However, the average
Returns on Equity for the year 2015-16 were found lowest i.e. 21.09%. The movement of average Return on Equity during the
period 2006-07 to 2015-16, is shown in the following graph
Graph-1:
From the above graph, it is found that the behavior of average ROE of 30 Sensex companies during the period
from 2006-07 to 2015-16 was in bearish trend. This result has negative repercussion on Indian Capital Market
under global view.
www.icmai.in May 2017 l The Management Accountant 99