
Page 67 - MA - May 2017
P. 67
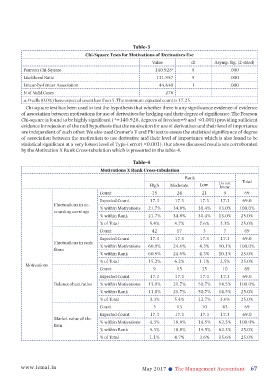
Table-3
Chi-Square Tests for Motivations of Derivatives Use
Value df Asymp. Sig. (2-sided)
Pearson Chi-Square 140.928 a 9 .000
Likelihood Ratio 131.857 9 .000
Linear-by-Linear Association 44.640 1 .000
N of Valid Cases 276
a. 0 cells (0.0%) have expected count less than 5. The minimum expected count is 17.25.
Chi-square test has been used to test the hypothesis that whether there is any significance evidence of evidence
of association between motivations for use of derivatives for hedging and their degree of significance. The Pearson
Chi-square is found to be highly significant (²=140.928, degrees of freedom=9 and <0.001) providing sufficient
evidence for rejection of the null hypothesis that the motivation for use of derivatives and their level of importance
are independent of each other. We also used Cramer’s V and Phi test to assess the statistical significance of degree
of association between the motivation to use derivative and their level of importance which is also found to be
statistical significant at a very lowest level of Type-I error(<0.001). Our above discussed results are corroborated
by the Motivation X Rank Cross-tabulation which is presented in the table-4.
Table-4
Motivations X Rank Cross-tabulation
Rank
High Moderate Low Do not Total
know
Count 15 24 21 9 69
Expected Count 17.3 17.3 17.3 17.3 69.0
Fluctuations in ac-
% within Motivations 21.7% 34.8% 30.4% 13.0% 100.0%
counting earnings
% within Rank 21.7% 34.8% 30.4% 13.0% 25.0%
% of Total 5.4% 8.7% 7.6% 3.3% 25.0%
Count 42 17 3 7 69
Expected Count 17.3 17.3 17.3 17.3 69.0
Fluctuations in cash
% within Motivations 60.9% 24.6% 4.3% 10.1% 100.0%
flows
% within Rank 60.9% 24.6% 4.3% 10.1% 25.0%
% of Total 15.2% 6.2% 1.1% 2.5% 25.0%
Motivations
Count 9 15 35 10 69
Expected Count 17.3 17.3 17.3 17.3 69.0
Balance sheet ratios % within Motivations 13.0% 21.7% 50.7% 14.5% 100.0%
% within Rank 13.0% 21.7% 50.7% 14.5% 25.0%
% of Total 3.3% 5.4% 12.7% 3.6% 25.0%
Count 3 13 10 43 69
Expected Count 17.3 17.3 17.3 17.3 69.0
Market value of the
% within Motivations 4.3% 18.8% 14.5% 62.3% 100.0%
firm
% within Rank 4.3% 18.8% 14.5% 62.3% 25.0%
% of Total 1.1% 4.7% 3.6% 15.6% 25.0%
www.icmai.in May 2017 l The Management Accountant 67