Page 16 - Cost_Competitiveness
P. 16
16
The Institute of Cost Accountants of India
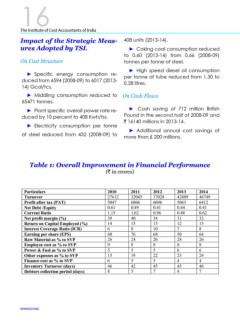
Impact of the Strategic Meas- 408 units (2013-14).
ures Adopted by TSL ► Coking coal consumption reduced
to 0.60 (2013-14) from 0.66 (2008-09)
On Cost Structure tonnes per tonne of steel.
► High speed diesel oil consumption
► Specifc energy consumption re- per tonne of tube reduced from 1.30 to
duced from 6594 (2008-09) to 6017 (2013- 0.28 litres.
14) Gcal/tcs.
► Middling consumption reduced to On Cash Flows
65471 tonnes.
► Plant specifc overall power rate re- ► Cash saving of 712 million British
duced by 10 percent to 408 Kwh/tss. Pound in the second half of 2008-09 and
` 16140 millions in 2013-14.
► Electricity consumption per tonne
► Additional annual cost savings of
of steel reduced from 432 (2008-09) to more than £ 200 millions.
Table 1: Overall Improvement in Financial Performance
(` in crores)
Particulars 2010 2011 2012 2013 2014
Turnover 27612 32045 37028 42889 46749
Profit after tax (PAT) 5047 6866 6696 5063 6412
Net Debt /Equity 0.61 0.49 0.41 0.44 0.41
Current Ratio 1.15 1.62 0.96 0.88 0.62
Net profit margin (%) 39 40 34 31 32
Return on Capital Employed (%) 14 15 13 12 13
Interest Coverage Ratio (ICR) 6 8 10 7 8
Earning per share (EPS) 60 76 68 50 64
Raw Material as % to SVP 26 24 26 28 26
Employee cost as % to SVP 9 9 8 8 8
Power & Fuel as % to SVP 5 5 5 6 6
Other expenses as % to SVP 15 19 22 23 24
Finance cost as % to SVP 6 5 5 4 4
Inventory Turnover (days) 46 42 45 45 46
Debtors collection period (days) 8 5 7 8 7
www.icmai.
The Institute of Cost Accountants of India
Impact of the Strategic Meas- 408 units (2013-14).
ures Adopted by TSL ► Coking coal consumption reduced
to 0.60 (2013-14) from 0.66 (2008-09)
On Cost Structure tonnes per tonne of steel.
► High speed diesel oil consumption
► Specifc energy consumption re- per tonne of tube reduced from 1.30 to
duced from 6594 (2008-09) to 6017 (2013- 0.28 litres.
14) Gcal/tcs.
► Middling consumption reduced to On Cash Flows
65471 tonnes.
► Plant specifc overall power rate re- ► Cash saving of 712 million British
duced by 10 percent to 408 Kwh/tss. Pound in the second half of 2008-09 and
` 16140 millions in 2013-14.
► Electricity consumption per tonne
► Additional annual cost savings of
of steel reduced from 432 (2008-09) to more than £ 200 millions.
Table 1: Overall Improvement in Financial Performance
(` in crores)
Particulars 2010 2011 2012 2013 2014
Turnover 27612 32045 37028 42889 46749
Profit after tax (PAT) 5047 6866 6696 5063 6412
Net Debt /Equity 0.61 0.49 0.41 0.44 0.41
Current Ratio 1.15 1.62 0.96 0.88 0.62
Net profit margin (%) 39 40 34 31 32
Return on Capital Employed (%) 14 15 13 12 13
Interest Coverage Ratio (ICR) 6 8 10 7 8
Earning per share (EPS) 60 76 68 50 64
Raw Material as % to SVP 26 24 26 28 26
Employee cost as % to SVP 9 9 8 8 8
Power & Fuel as % to SVP 5 5 5 6 6
Other expenses as % to SVP 15 19 22 23 24
Finance cost as % to SVP 6 5 5 4 4
Inventory Turnover (days) 46 42 45 45 46
Debtors collection period (days) 8 5 7 8 7
www.icmai.